Visualizing JavaScript Project Structure
Recently I thought to myself: fairly frequently I dive into a big JS codebase and need to poke around for a while to get acquainted with the project structure, wouldn’t it be nice if I could have a more visual way of seeing the whole thing to make sense of it all?
It was this need I was trying to fill when I embarked on my open
dev
project last Friday. In this post I’ll try to walk through the steps I took so
you can replicate them. If you want to just to play with the final project,
it’s available as an npm module named jsviz (npm:
jsviz, GitHub:
jeffcarp/jsviz).
Representing the structure
Due to the way CommonJS works, circular dependencies are impossible. That means
that if we map all the require calls in a JS project, the resulting structure
is a directed acyclic graph.
The way I chose to represent this in JavaScript was an Object of Arrays.
Each key on the Object was a file or a module (the vertices), which contained
an Array of the files or modules it required (the edges). Here’s what I had
in mind:
taco.js:
var fs = require('fs');
var salsa = require('./salsa.js');
salsa.js:
var fs = require('fs');
Resulting graph:
var graph = {
  "/taco.js": ["fs", "/salsa.js"]
  "/salsa.js": ["fs"]
};
Walking the syntax tree
So to begin, I read in all the JS files from a directory using the glob package.
var graph = {};
var targetDir = './path/to/project';

glob(targetDir+'/**/*.js', {}, function (err, files) {
  // ...
});
Then I had to parse out all the require calls from each file. I wanted to do
this the “right way” (e.g. not using regular expressions). Fortunately there
are tools out there that make parsing and iterating through a JavaScript syntax
tree super easy - like esprima and estraverse, respectively.
To generate a syntax tree using esprima, it’s as simple as passing in a string
to esprima.parse:
files.forEach(function (fileName) {
  var contents = fs.readFileSync(fileName, 'utf8');
  var ast = esprima.parse(contents);
  graph[fileName] = graph[fileName] || [];
  // ...
});
Next, in order to pick out all the require calls, we need to visit every node
in the syntax tree and see if it’s a require call. This can be done super easy
with estraverse. If it is requireing something, we can add its target to
the graph.
estraverse.traverse(ast, {
  enter: function (node, parent) {
    if (nodeIsRequireCall(node)) {
      var requireTarget = node.arguments[0].value;

      if (graph[fileName].indexOf(requireTarget) === -1) {
        graph[requireTarget] = graph[requireTarget] || [];
        graph[fileName].push(requireTarget);
      }
    }
  }
});

function nodeIsRequireCall(node) {
  return (
    node &&
    node.type === 'CallExpression' &&
    node.callee &&
    node.callee.name === 'require'
  );
}
Note: the actual code has a couple of filtering lines I left out of these snippets for the sake of readability. See the final source here.
Visualizing the graph
Now we have a reasonably accurate dependency graph. I searched Google for d3 directed acyclic graph and found this example. I implemented it, tweaked it a little, and got something that didn’t look half bad. Here’s jsviz visualizing jsviz:
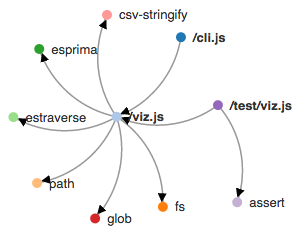
The arrows point to what a file is requireing. So in the example above,
/cli.js requires /viz.js.
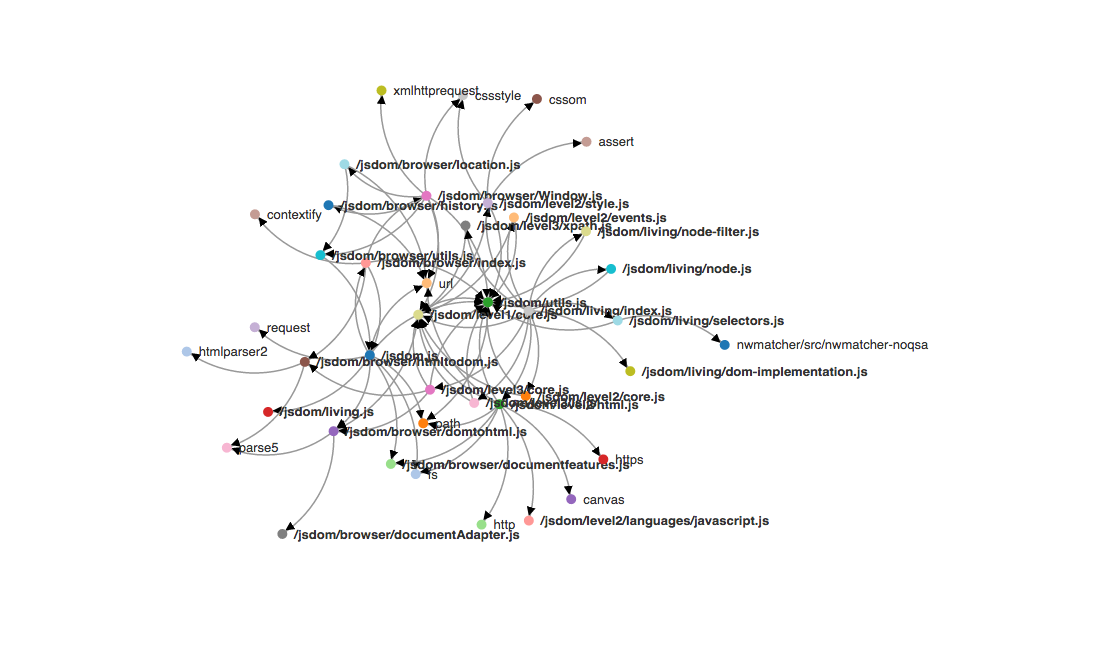
Here’s one of jsdom, a much bigger module: